Bad News, DBAs, We Are All Developers Now
I sometimes joke that I’m a Junior Developer and a Principal Database Administrator, which is why I have a Staff level title. I’m not sure …
Read MoreI frequently need to see rowcounts and execution time for queries while they’re running. Maybe I’m troubleshooting a slow query that’s still executing, or I want to understand which operators are causing the slowdown before the query completes.
Last week at the PASS Summit I learned some little nuances about how this works that I’d missed.

For application queries: Use sp_WhoIsActive with @get_plans = 1 to see rowcounts for in-flight queries. Rowcounts show up even if the session running the query doesn’t have standard profiling enabled.
When reproducing a slow query from my own session: Enable actual execution plans (Ctrl+M) in the session running the query, then use sp_WhoIsActive with @get_plans = 1 in another session if it runs long. This includes not only rowcounts per operator, but also query execution times per operator in the in-flight plan that you nab.
EXECUTE sp_WhoIsActive
    @get_plans = 1;
If you want to save a script for this, you can use SET STATISTICS XML ON in the script that is running the query you want to profile instead of enabling actual execution plans in that session.
I used to think that execution times per operator showing up in sp_WhoIsActive was random. The rowcounts pretty much always show up on recent versions of SQL Server, but sometimes I’d see execution times per operator, sometimes I wouldn’t. It seemed like luck.
I’d missed the memo that execution times per operator only appear when standard query profiling is enabled in the session running the query. It’s not random at all. I was enabling it without realizing it—when I had already enabled actual execution plans on queries I was running for repro, that automatically enabled standard query profiling.
Standard query profiling enables additional runtime statistics collection. When enabled, SQL Server collects execution times per operator as the query runs. Rowcounts are available even without standard profiling enabled, but execution times per operator require it.
sp_WhoIsActive queries the sys.dm_exec_query_statistics_xml dynamic management view, which returns the query execution plan for in-flight requests with transient statistics.
Query this DMV directly if you can’t install sp_WhoIsActive or prefer a simple approach:
SELECT
    eqs.query_plan,
    er.session_id,
    er.request_id,
    er.database_id,
    er.start_time,
    er.[status],
    er.wait_type,
    er.wait_resource,
    cpu_time_sec = (er.cpu_time / 1000.),
    logical_reads_MB = (er.logical_reads * 8) / 1024. / 1024.,
    granted_memory_MB = er.granted_query_memory * 8 / 1024. / 1024.,
    er.dop,
    er.query_hash,
    er.query_plan_hash
FROM sys.dm_exec_requests AS er
CROSS APPLY sys.dm_exec_query_statistics_xml(er.session_id) AS eqs
WHERE er.session_id <> @@SPID;Here’s a script that takes a bit of time to run, which can be useful for testing this against the StackOverflow2013 sample database. This drops any nonclustered indexes and auto-created stats that exist, then creates two nonclustered indexes:
USE StackOverflow2013;
GO

EXECUTE dbo.DropIndexes;
GO

CREATE INDEX
    Reputation
ON dbo.Users
    (Reputation)
INCLUDE
    (
        Id,
        DisplayName
    )
WITH
    (SORT_IN_TEMPDB = ON, DATA_COMPRESSION = PAGE);
GO

CREATE INDEX
    ParentId_OwnerUserId
ON dbo.Posts
    (
        ParentId,
        OwnerUserId
    )
WITH
    (SORT_IN_TEMPDB = ON, DATA_COMPRESSION = PAGE);
GO
After I get those index creation operations running in one session, I run the query above in a second session to capture the in-flight plan.
I do NOT have actual execution plans enabled on the query that is creating the indexes, so the in-flight plan has rowcounts on each operator, but no timing information:
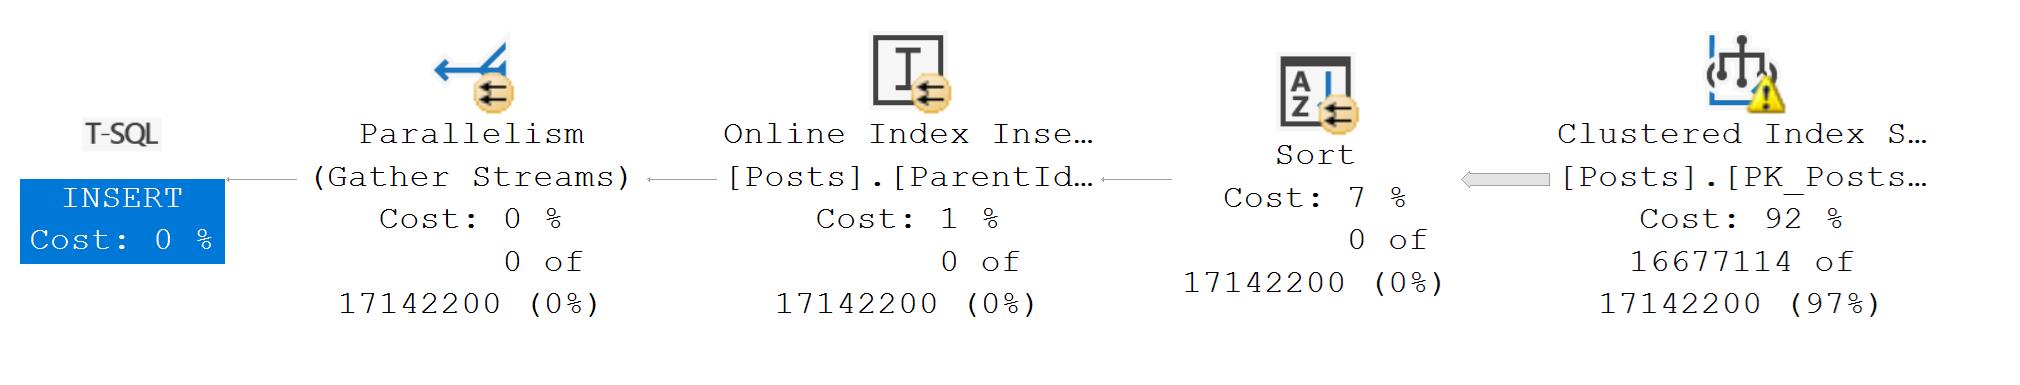
In this execution plan, you can see rowcounts on each operator showing how many rows have been processed so far:
If I rerun this process but first run SET STATISTICS XML ON; or enable actual execution plans in the session that is creating the indexes, I additionally see execution time per operator in the in-flight plan:

With standard query profiling enabled, each operator shows both rowcounts and timing information:
Use this technique when troubleshooting slow queries or understanding query progress. It’s particularly helpful for identifying which operators are causing slowdowns before a query completes.
Note that cost estimates in the plan (which show as percentages) are estimates made at the time the query was compiled. These cost estimates are NOT updated during or after runtime of the query. Queries may also reuse an execution plan where the cost estimates were made previously for a different query execution, based on the parameters that were sniffed when the plan was compiled.
For more details on the query profiling infrastructure, see Microsoft’s documentation.


Copyright (c) 2025, Catalyze SQL, LLC; all rights reserved. Opinions expressed on this site are solely those of Kendra Little of Catalyze SQL, LLC. Content policy: Short excerpts of blog posts (3 sentences) may be republished, but longer excerpts and artwork cannot be shared without explicit permission.