Monitoring-Troubleshooting

Category: monitoring-troubleshooting

How to See Rowcounts and Execution Time for In-Flight Queries in SQL Server

How to See Rowcounts and Execution Time for In-Flight Queries in SQL Server

I frequently need to see rowcounts and execution time for queries while they’re running. Maybe I’m troubleshooting a slow query that’s still executing, or I want to understand which operators are causing the slowdown before the query completes.

Last week at the PASS Summit I learned some little nuances about how this works that I’d missed.

Continue reading

What Is the CPU Wait in Datadog SQL Server Monitoring? How Does It Compare to Waiting on CPU?

What Is the CPU Wait in Datadog SQL Server Monitoring? How Does It Compare to Waiting on CPU?

I use Datadog on a regular basis, and I’m a pretty huge fan. The monitoring pack for SQL Server (and its PAAS variants) is still pretty rudimentary, but it evolves regularly. That’s NOT what I’m a fan of, though.

What makes me a raving fan is the flexibility of Datadog’s notebooks and dashboards, combined with the ability to create all sorts of custom metrics and monitors. There are always things in SQL Server monitoring packs that I have strong opinions about. Datadog lets me take what I want, build what I need that isn’t contained in that, and ignore the rest. For a team that has the budget to afford Datadog paired with dedicated database staff with the time and resources to do this work, this can be a great fit.

Continue reading

Finally, a SQL Server Monitoring System That Leverages Query Store

Finally, a SQL Server Monitoring System That Leverages Query Store

I’ve spent a bit of time with Microsoft’s new database watcher tool for Azure SQL recently.

There are a lot of things I like about database watcher– which is currently in preview and which refuses to Capitalize Its Name– but it does one big thing that I really, really like: it collects data from Query Store. You can access that Query Store data from built-in database watcher dashboards, query it using KQL, or (something something) in Microsoft Fabric if you’ve got money to burn on your monitoring data.

Continue reading

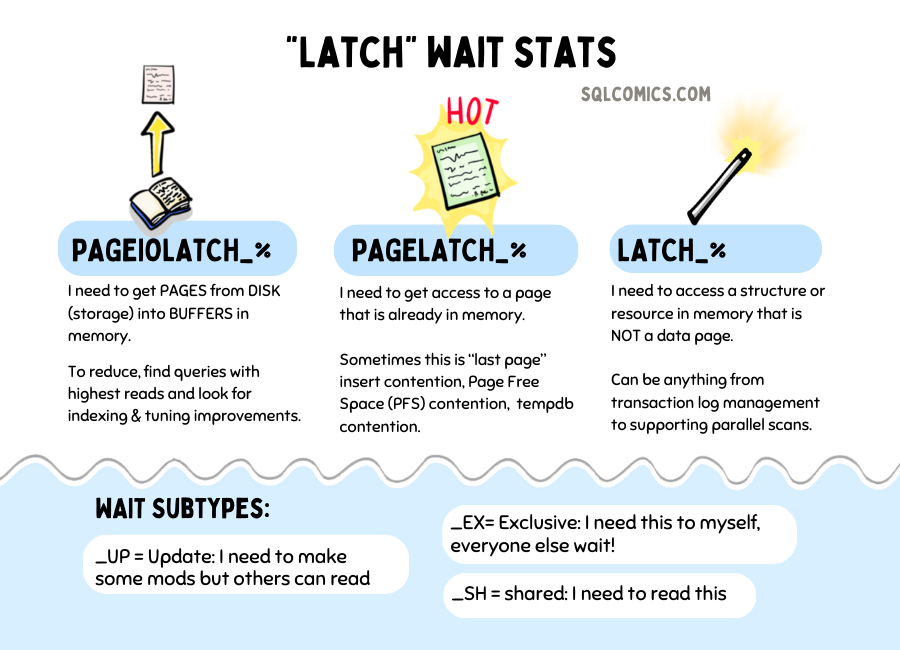
PAGELATCH, PAGEIOLATCH, and LATCH Waits in SQL Server

PAGELATCH, PAGEIOLATCH, and LATCH Waits in SQL Server

I’ve long found it tricky to remember and explain the differences between three similar-sounding waits in SQL Server that all have “LATCH” in the name: PAGELATCH, LATCH, and PAGEIOLATCH waits.

Here’s an illustration that explains these waits, along with wait subtypes.

Continue reading

ChatGPT Says SSMS Is the Best SQL Server Monitoring Tool

ChatGPT Says SSMS Is the Best SQL Server Monitoring Tool

One thing I enjoy about AI chatbots is that they can help me recognize when I’ve missed something obvious.

Continue reading

Find Query Execution Timeouts with Query Store

Find Query Execution Timeouts with Query Store

During a discussion of troubleshooting query timeouts in Azure SQL Database recently, I wondered: can you find queries that timed out in Query Store?

You can.

Continue reading

What I Learned Writing About How to Diagnose and Troubleshoot High CPU in Azure SQL Database

What I Learned Writing About How to Diagnose and Troubleshoot High CPU in Azure SQL Database

Writing helps me learn. In my job as a Content Developer, this is more true than ever: there’s a fantastic group of folks, both in the Database Docs team and in the Microsoft Data Platform engineering team, who review and contribute to content.

I’ve just had the pleasure of publishing my first new article in the Microsoft Docs, Diagnose and troubleshoot high CPU on Azure SQL Database.

Continue reading