Adaptive Joins and Memory Grants in SQL Server
Adaptive joins let the optimizer choose between a Hash Join and a Nested Loop join at runtime, which can be fantastic for performance when row count …
Read MoreSQL Server 2016’s new Query Store feature makes it easier than ever for DBAs and developers to identify the most important queries to tune– and perhaps apply a quick fix by pinning an execution plan.
But how does the new Query Store feature work with SQL Server’s existing “missing index” request feature? When the query optimizer generates a plan, it’s frequently able to see a place where an index might make the query faster and flag it in as an “index request”. Does that work with Query Store?
I’m using the free SQLIndexWorkbook database– now renamed to BabbyNames to look at how these two features work together.
You can enable Query Store through the GUI just by right clicking on the database and going into its properties. Here’s the same thing being done in TSQL:
USE master
GO
ALTER DATABASE SQLIndexWorkbook SET QUERY_STORE = ON
GO
ALTER DATABASE SQLIndexWorkbook SET QUERY_STORE
    (OPERATION_MODE = READ_WRITE, CLEANUP_POLICY = (STALE_QUERY_THRESHOLD_DAYS = 30),
    DATA_FLUSH_INTERVAL_SECONDS = 300, INTERVAL_LENGTH_MINUTES = 10)
GO
You have a few things to select when you enable QueryStore. I picked an interval length of just 10 minutes just for testing purposes.
I generated some activity in the database for Query Store to see using these queries. The first two queries generate a missing index request, the third does not.
USE SQLIndexWorkbook;
GO

/* I ran this once to create the index */
CREATE NONCLUSTERED INDEX ix_FirstNameByYear_FirstNameId ON agg.FirstNameByYear (FirstNameId ASC);
GO

/* I ran the queries below many times to generate activity */
SELECT
    fact.ReportYear,
    fact.Gender,
    fact.NameCount
FROM agg.FirstNameByYear AS fact
JOIN ref.FirstName AS dim
    ON fact.FirstNameId=dim.FirstNameId
WHERE
    fact.Gender = 'M' AND
    dim.FirstName = 'Sue';
GO

SELECT
    COUNT(*)
FROM agg.FirstNameByYear AS fact
JOIN ref.FirstName AS dim
    ON fact.FirstNameId=dim.FirstNameId
WHERE
    fact.Gender = 'M';
GO

SELECT
    fact.ReportYear,
    fact.Gender
FROM agg.FirstNameByYear AS fact
JOIN ref.FirstName AS dim
    ON fact.FirstNameId=dim.FirstNameId
WHERE
    fact.Gender = 'M';
GO
I’m not recompiling these queries or causing their execution plans to vary, so I don’t expect to see any “regression” in Query Store. In this case I just want to see how it shows me which queries have an index request and play around with how to find them.
Query Store focuses on the queries that are using the most resources, overall resource consumption, and the queries that have gotten slower with different plans. Query Store makes it easy to see the plans for those types of queries and you can visually identify if there’s an index request in the execution plan for that time period.
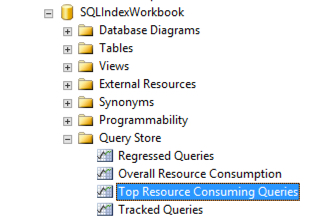
Here’s how you can view Query Store’s reports in Object Explorer. Just doubleclick on the interactive report you want to use:

Opening “Top Resource Consuming Queries”, it shows me the top 25 plans by duration. It shows detail information for the #1 top plan by default, and colors that bar green.
In my case, there’s no missing index request on the top plan:
How can I tell there’s no index request? In the bottom pane for the graphical execution plan, there’s no green hint appearing!
Even though there’s no index request, this is the query that’s run for the greatest duration. And looking at that plan, I can see that it’s doing an index scan. It’s worth looking at the query to see if it might be able to be improved, or ask what it’s for. I can also tell from the chart in the top right that this query ran 5 times, all in the same time interval. Pretty handy.
Clicking on the second bar in the graph of top resource consumers, I do find a missing index request for the execution plan I’m examining:
Now the plan on the bottom shows an index request with the green hint.
One little issue: when I right click on the query plan and select “Missing Index Details”, the GUI throws an error. But I’m using a pre-release CTP, so I’m not judging.
I can still right click on the plan and say “Show Execution Plan XML” and see the missing index request details in the execution plan itself. I can also click on a “script” button at the top and script out the TSQL for the query itself if I’d like to test it directly.
I like the GUI quite a bit for Query Store so far. But sometimes, you just want to run a query.
Here’s a bit of TSQL that looks for the queries that have asked for an index in the last 24 hours (and been seen by QueryStore), and aggregates information about them.
The query shows the most recent plan collected only. This might be a little confusing, because the query could potentially have different plans over that time, and not all of them might have missing index requests. In other words, you may need to do a little more digging.
SELECT
    SUM(qrs.count_executions) * AVG(qrs.avg_logical_io_reads) as est_logical_reads,
    SUM(qrs.count_executions) AS sum_executions,
    AVG(qrs.avg_logical_io_reads) AS avg_avg_logical_io_reads,
    SUM(qsq.count_compiles) AS sum_compiles,
    (SELECT TOP 1 qsqt.query_sql_text FROM sys.query_store_query_text qsqt
        WHERE qsqt.query_text_id = MAX(qsq.query_text_id)) AS query_text,
    TRY_CONVERT(XML, (SELECT TOP 1 qsp2.query_plan from sys.query_store_plan qsp2
        WHERE qsp2.query_id=qsq.query_id
        ORDER BY qsp2.plan_id DESC)) AS query_plan,
    qsq.query_id,
    qsq.query_hash
FROM sys.query_store_query qsq
JOIN sys.query_store_plan qsp on qsq.query_id=qsp.query_id
CROSS APPLY (SELECT TRY_CONVERT(XML, qsp.query_plan) AS query_plan_xml) AS qpx
JOIN sys.query_store_runtime_stats qrs on qsp.plan_id = qrs.plan_id
JOIN sys.query_store_runtime_stats_interval qsrsi on qrs.runtime_stats_interval_id=qsrsi.runtime_stats_interval_id
WHERE
    qsp.query_plan like N'%<MissingIndexes>%'
    and qsrsi.start_time >= DATEADD(HH, -24, SYSDATETIME())
GROUP BY qsq.query_id, qsq.query_hash
ORDER BY est_logical_reads DESC
GO
This isn’t a work of art, and may need tuning for large Query Store implementations in busy environments. Look at the end of the query– see that non sargable query_plan like N’%
I really like the way the Query Store feature was designed. It wasn’t just wrapped around the existing index request feature: it shows the requests if they are there, but it doesn’t fixate on them or prioritize by them.
And that’s totally fine, because the older index request feature isn’t perfect. The top duration query in my example above isn’t asking for an index, but it returns a ton of rows. It’s worth examining!
Copyright (c) 2025, Catalyze SQL, LLC; all rights reserved. Opinions expressed on this site are solely those of Kendra Little of Catalyze SQL, LLC. Content policy: Short excerpts of blog posts (3 sentences) may be republished, but longer excerpts and artwork cannot be shared without explicit permission.