Bad News, DBAs, We Are All Developers Now
I sometimes joke that I’m a Junior Developer and a Principal Database Administrator, which is why I have a Staff level title. I’m not sure …
Read MorePerfmon counters are an excellent tool for monitoring and sometimes troubleshooting Microsoft SQL Server. But some counters can get you into trouble, because they don’t mean what many people think. Learn what to look out for in the world of widely-used perfmon counters.
The idea: Percentage of reads that come from memory (instead of having to go to disk)
The problem: This counter doesn’t take read-ahead reads into account. Read-ahead reads are an important type of physical read that use a special pre-fetching mechanism to pull data into memory. You could be doing lots of reads from disk, and this counter won’t show them if they’re using read-ahead.
This counter can give a false sense of security.
Better solution: Monitor LogicalDisk: Avg Disk Bytes/Read and Write, and Avg Disk sec/Read and Write. This gives you insight into latency when you’re accessing storage. The Avg Disk bytes counter can help you rule out blips or outliers from very small operations. You can also periodically sample the sys.dm_io_virtual_file_stats DMV in SQL Server for a database and file view of read and write MB and latency for the period between your samples (some code and math required).
The idea: Alert for slow storage
The problem: Modern storage may have a queue, but very low latency
This counter can cause false alarms.
Better solution: Monitor LogicalDisk counters and/or sys.dm_io_virtual_file_stats as explained above.
There are different types of page splits:
The idea: count page split type #1
The problem: this counts BOTH TYPES
This counter can cause false alarms.
Better solution: You can get fancy and track specific types of page splits with Extended Events. But honestly, I’m lazy, and I find it much easier to just regularly use an index maintenance solution that records which indexes are fragmented, and by how much. If an index is a “frequent flier” and gets highly fragmented very frequently, I’ll consider lowering the fillfactor for that index by 5%.
Whichever method you’re using, look at what the index is based on and consider how it’s used before lowering fillfactor. There are some tables where the application using it is going to regularly do something to fragment the heck out of it periodically, and you may as well just leave the fillfactor as is.
The idea: Alert if you have high table scans
The problem: Not all scans are “full scans”! For example: TOP queries can have scan operators that feed into a TOP operator which controls the flow of the query, and stops the scan after its received all the rows it needs. The counter also gives no indication of size of tables scanned: one scan could be 15 rows, or 150GB, it will still count as one.
This counter can cause false alarms.
Better solution: If you’re concerned about physical reads, monitor the windows disk counters as described above. If you’re concerned about queries doing large amounts of logical reads, query those using the SQL Server DMVs with a query like this:
The idea: Alert if you have high lock waits
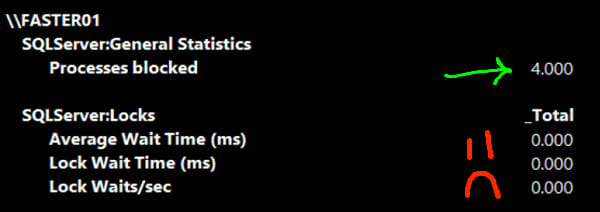
The problem: These counters update when the lock wait ends, not while it’s ongoing. Let’s say you have a query that’s blocked for five minutes. You’ll only see this in the perf monitor when it becomes un-blocked.
These counters can cause confusion and make you look for blocking queries at the wrong times.

Better solution:Monitor the SQL Server: General Statistics \ Processes Blocked counter instead. It gives you the number of sessions that are currently blocked.
If you want more information on troubleshooting and figuring out who is blocking who, check out my free course Troubleshooting Blocking & Deadlocks for Beginners.
Copyright (c) 2025, Catalyze SQL, LLC; all rights reserved. Opinions expressed on this site are solely those of Kendra Little of Catalyze SQL, LLC. Content policy: Short excerpts of blog posts (3 sentences) may be republished, but longer excerpts and artwork cannot be shared without explicit permission.