Bad News, DBAs, We Are All Developers Now
I sometimes joke that I’m a Junior Developer and a Principal Database Administrator, which is why I have a Staff level title. I’m not sure …
Read MoreSQL Server has more than one way to pull pages in from disk for your queries. SQL Server can do a physical read of an 8KB page, or an extent of 8 of those 8KB pages.
SQL Server can also use the “read-ahead” mechanism to pull even larger chunks of data in from disk when you have a query that wants to read a lot of data – because just plucking one 8KB page or even 64KB of pages into disk isn’t super fast when you need lotsa pages.

I took my simple test query from this prior post out for a drive, and measured its physical reads and read-ahead reads in a few different ways. Here’s what I found.
SQL Server will return information about how many reads you did to your session’s Messages tab when you run “SET STATISTICS IO ON”.
Here’s what it says for our query:
(2 row(s) affected)
Table 'Worktable'. Scan count 0, logical reads 0, physical reads 0, read-ahead reads 0, lob logical reads 0, lob physical reads 0, lob read-ahead reads 0.
Table 'Workfile'. Scan count 0, logical reads 0, physical reads 0, read-ahead reads 0, lob logical reads 0, lob physical reads 0, lob read-ahead reads 0.
Table 'FirstNameByBirthDate\_1966\_2015'. Scan count 1, logical reads 7758553, physical reads 5625, read-ahead reads 438117, lob logical reads 0, lob physical reads 0, lob read-ahead reads 0.
Table 'FirstName'. Scan count 1, logical reads 2, physical reads 2, read-ahead reads 0, lob logical reads 0, lob physical reads 0, lob read-ahead reads 0.
In this case, physical reads = 5,625 and read-ahead reads = 438,117 against our largest table. There are 2 other reads against the small FirstName table for a total of 443,384 physical pages read.
When I query the sys.dm_exec_query_stats DMV and pull back execution statistics just for my query (with a diagnostic query like this), it doesn’t have a separate column for read-ahead reads. Instead, it reports all reads from disk under physical reads:

Notably, this DMV shows that more physical reads were done than were reported by STATISTICS IO! It saw 483,128 physical reads.
Well, how about a trace? I ran a quick trace on my session and collected sql_statement_completed. Like sys.dm_exec_query_stats, it doesn’t separate out read-ahead reads: it reports everything as physical reads.

I was really happy to see that the trace agreed with the DMV, and that they both saw 483,128 physical reads. It’s nice to have a little consistency!
As Tim Chapman wrote over on the SQL PFE blog, the sqlserver.file_read_completed extended event lets you see the number of reads from disk and the size of physical reads done.
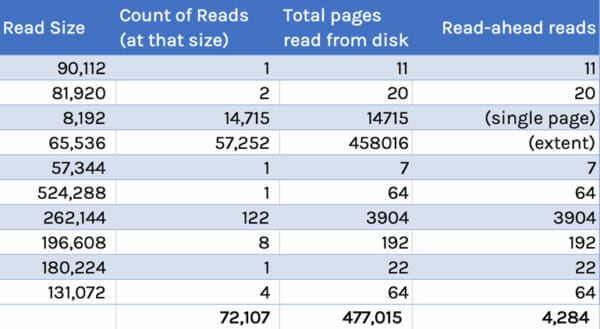
So I set up my Extended Events trace, cleared out my buffer pool, and ran my query. Here’s the physical read count and sizes, I saw, with some columns added for analysis:

The “read-ahead reads” column here has been converted to the page count read. I didn’t include single page reads or the reads of a single extent in that column. (I also was a little lazy and didn’t bother to filter out “cache warming” pages read, which is probably around 9 pages, but don’t tell anyone, OK?)
This trace saw fewer read-ahead reads than STATISTICS IO reported. It also saw fewer physical reads than sys.dm_exec_query_stats or sql_statement_completed saw. But we’re in the ballpark, and these are different methods of measurement.
It’s actually not easy to see how many read-ahead reads your query is doing! STATISTICS IO is one of the few places that breaks it out in a way that’s simple to see. I see these numbers as a ballpark estimate, and I wouldn’t bet on them being “exactly right”. They’re good enough to be really useful.
When you’re looking at sys.dm_exec_query_stats, or you’re tracing statements completed, in those places “physical reads” includes reads of all sizes– including read-ahead reads.
Copyright (c) 2025, Catalyze SQL, LLC; all rights reserved. Opinions expressed on this site are solely those of Kendra Little of Catalyze SQL, LLC. Content policy: Short excerpts of blog posts (3 sentences) may be republished, but longer excerpts and artwork cannot be shared without explicit permission.