Adaptive Queries in Standard Edition: Interleaved Exec for Multi-Statement TVFs
It’s tough to keep track of which features work in each version of SQL Server, and which Editions support them.
My memory told me that the new …
Read MoreYou know how they say “don’t sweat the small stuff”?
That’s good advice for lots of things, but when it comes to query tuning - I WANT TO KNOW MORE when something is inconsistent. I just can’t let it go. I go total X-Files: The Truth Is Out There.

The bright side of this habit is that it makes finding blog topics fairly easy.
I set up a script to measure duration and wait statistics for a few queries. It followed this flow:
I was gathering the data to graph and show query durations along with the amount of CXPACKET and CXCONSUMER waits at different DOPs.
Whenever I can, I run a test more than once. I was graphing my wait statistics, and I noticed that on different executions of the procedure, my parallelism waits varied.
Varied more than a small amount.
Luckily for me, I read the release notes for Cumulative Updates for SQL Server most of the time, and after noticing the variation I remembered FIX: CXPACKET and CXCONSUMER wait types show inconsistent results for some parallel query plans in SQL Server 2017.
I checked, and sure enough, my little cloud VM was on SQL Server 2017 CU3, and that fix is in CU4.
I patched to CU5 (latest and greatest for my little test instance, ya know), redid all my testing twice, and admired my now-more-consistent charts.
I was getting consistent results for query duration when I ran the query in the script above, which started at a high degree of parallelism, and then went to low.
But I found that for one of my test queries, when I took the query and ran it in my own session to look at Query Time Stats in the execution plan, it took much longer.
For example, at MAXDOP 13:
More than twice as long.
Why was it so much slower when I ran it in another session?
I had plenty of memory on this instance, and I’d made sure to set ‘max server memory (mb)’ plenty high, but could something be causing me to do physical reads when I ran the query in my own session?
This made me realize that my test script wasn’t quite fair to the DOP that ran first – it might have to do physical reads where following queries made use of data in memory. This is a private test instance, so I changed the script to run everything with cold cache, by dropping clean buffers between runs.
I was getting the same plan with the same cost both in my “slow session” and in the script.
I was running everything from an SSMS instance on my laptop against a SQL Server on a VM in the Azure Cloud. Could I be getting some weird kind of latency on one session?
Nope. And my query wasn’t even returning a result set to my SSMS window – it was putting the results into a table in the cloud.
Could something about the Dynamic SQL be making it faster? Or had I made some sort of typo and the Dynamic SQL query was a little bit different in a way that made it faster?
Nope, it really was the same query, and the same plan. When I copied the longer script and adjusted the variables to only run for DOP 13 in my “slow” session, it was also slow.
I sometimes use these to measure queries, but in this case I wasn’t using them in either session.
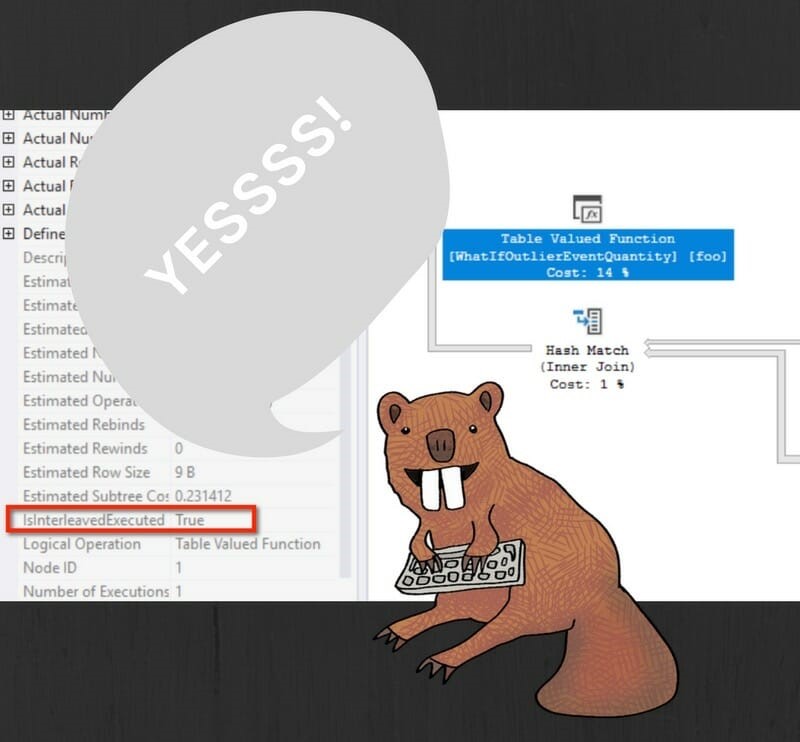
Yes, it was.
This query was a reminder of the observer effect: watching something can change its behavior. In this case, “watching” the query by enabling actual execution plans made it take twice the duration.
I had actual plans enabled in my “slow” session, and I didn’t have them on in the session where I was measuring duration and wait statistics in the loop. (If you’ve ever accidentally left actual plans enabled when you’re running TSQL in a loop, you know how much SSMS doesn’t love that.)
I tested this a few different ways, including in another instance of SSMS local to the VM itself, and sure enough - actual plan drags this puppy down, although it’s a relatively simple query.
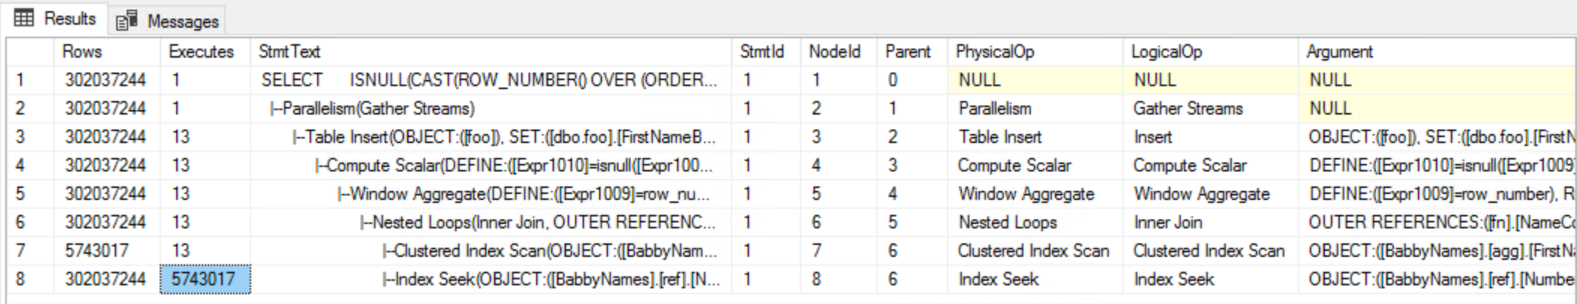
I disabled graphical execution plans in Management Studio, then tested a few varieties of outputting actual plan info:
I tested these independently. Both of these had the same impact on the query as using the graphic execution plan - the query took twice as long.
I did feel kind of fancy looking at actual plan info in text format, though. We all know that hackers ALWAYS use text interfaces.
I expected this to take a full three minutes, but it only took a bit longer than the ‘Actual Plan’ run in this case: 2 minutes 5 seconds.
I ran the same query against the same data on a local test VM on my MacBook Pro, which has 4 cores.
The duration at MAXDOP 4 on the MacBook Pro:
Hmm, the discrepancy is much smaller on the small instance.
So I retested at MAXDOP 4 on the cloud VM. Note that this gets a different plan - similar shapes, but different costs (much more memory on that instance).
To recap what I mentioned above, MAXDOP 13 on the cloud VM:
Just for fun, MAXDOP 16 on the cloud VM (just in case you thought the issue was 13 being unlucky)
Did I mention I’m compulsive about investigating this? MAXDOP 20 on the cloud VM (all its cores):
Innnnnteresting. The impact of having actual plans enabled for this query is more pronounced on the cloud VM. The skew is greater at a higher DOP, although it’s not linear.
There’s always overhead to using an actual plan.
Frequently it’s minimal, but sometimes it’s really significant - and the amount it varies may differ on different hardware, and at different degrees of parallelism.


Copyright (c) 2025, Catalyze SQL, LLC; all rights reserved. Opinions expressed on this site are solely those of Kendra Little of Catalyze SQL, LLC. Content policy: Short excerpts of blog posts (3 sentences) may be republished, but longer excerpts and artwork cannot be shared without explicit permission.