Your AI Doesn't Need to Dig Around in Production Databases. It Needs Better Briefings.
I increasingly hear or read the advice to solve problems by querying MCP servers on production databases.
Meanwhile, I’m reading output from an …
Read MoreStatistics in SQL Server are simple in theory: they help the optimizer estimate how many rows a query might return.
In practice? Things get weird fast. Especially when you start filtering on multiple columns, or wondering why the optimizer thinks millions of rows are coming back when you know it’s more like a few hundred thousand.
In this post, I’ll walk through examples using single-column, multi-column, and filtered statistics—and show where estimates go off the rails, when they get back on track, and why that doesn’t always mean you need to update everything with FULLSCAN.
To get started, I’ve dropped all my existing indexes and statistics. I’ve created a helper object that lists all the statistics on a given table.
ALTER DATABASE StackOverflow2013 SET COMPATIBILITY_LEVEL = 160;
GO
USE StackOverflow2013;
GO
CREATE OR ALTER PROCEDURE
dbo.ListStatistics
(
@ObjectName sysname
)
AS
BEGIN
SET NOCOUNT ON;
SELECT
statistic_name = s.name,
leading_column = c.name,
auto_created = s.auto_created,
user_created = s.user_created,
has_filter = s.has_filter,
filter_definition = s.filter_definition,
no_recompute = s.no_recompute
FROM sys.stats AS s
JOIN sys.stats_columns AS sc
ON s.object_id = sc.object_id
AND s.stats_id = sc.stats_id
JOIN sys.columns AS c
ON sc.object_id = c.object_id
AND sc.column_id = c.column_id
WHERE sc.stats_column_id = 1
AND s.object_id = OBJECT_ID(@ObjectName)
ORDER BY
s.name;
END;
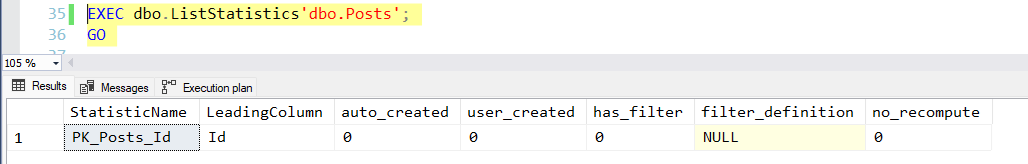
GOBefore I get started, the dbo.Posts table has a single statistic.
This statistic is associated with the clustered index on the Id column. Whenever an index is created in SQL Server, a statistic is created along with that index.
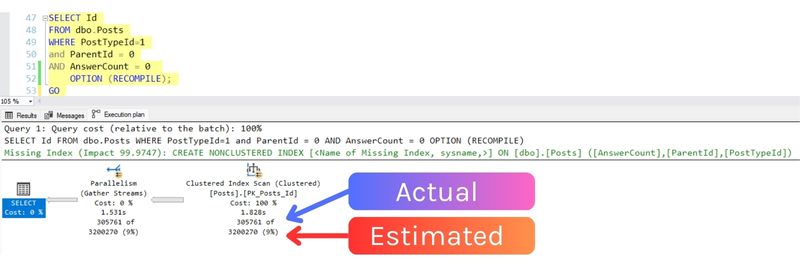
Our example query has three predicates, on PostTypeId, ParentId, and AnswerCount.
To simplify things so auto-parameterization and query plan reuse don’t involved, I’ve added an OPTION (RECOMPILE) hint to the query.
SELECT
Id
FROM dbo.Posts AS p
WHERE p.PostTypeId = 1
AND p.ParentId = 0
AND p.AnswerCount = 0
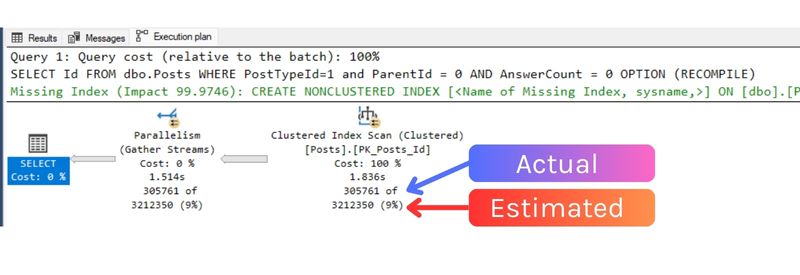
OPTION (RECOMPILE);When I give this a run, the query plan shows…
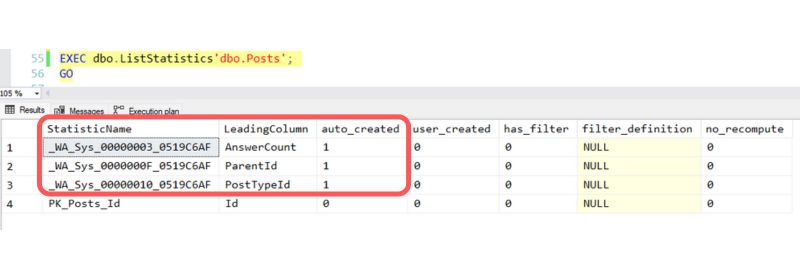
I re-run dbo.ListStatistics and see that three column statistics were automatically created, one on each of the three predicates in my query. I have the AUTO_CREATE_STATISTICS setting enabled for the StackOverflow2013 database– that’s a default setting, and it allows SQL Server to create these small helper objects to put together this estimate.
Each of these statistics took a sampling of rows from the table and used that sampling to create a histogram with “steps” describing what values are in the table and how many rows exist for some values. This is stored along with metadata: how many rows were in the table at the time of the sampling? How many rows were sampled? About how many unique values exist in the column?
For example, here is a view of the histogram for the automatically created single column statistic on the PostTypeId column:
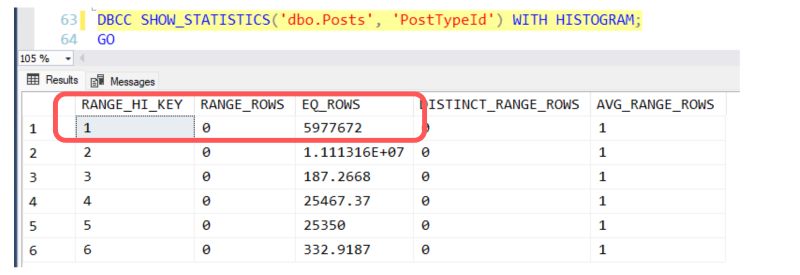
Based on a sampling of the data, there were estimated to be 5,977,672 rows in dbo.Posts with PostTypeId=1 at the time the statistic was auto-created.
The column statistics created for ParentId and AnswerCount similarly describe how data is distributed in those columns.
SQL Server can use these statistics to make estimates, but note that none of these statistics describe data distributions for all three columns when they are used together.
Let’s say we have an index on the first two columns in our predicate. Here’s the index:
CREATE INDEX
    ix_Posts_PostTypeId_ParentId
ON dbo.Posts
(
    PostTypeId,
    ParentId
)
WITH
    (DATA_COMPRESSION = PAGE);
GO
I’ve created a nonclustered index that does not fully “cover” my query: it has two out of three predicates.
I run my query again, and SQL Server does not choose to use my new index. Its row estimate is slightly different:
Why is this estimate just a little bit higher?
If I use DBCC SHOW_STATISTICS to describe the statistic associated with the index, it does describe a little bit about more than the first column, but not much. Important things to notice are:
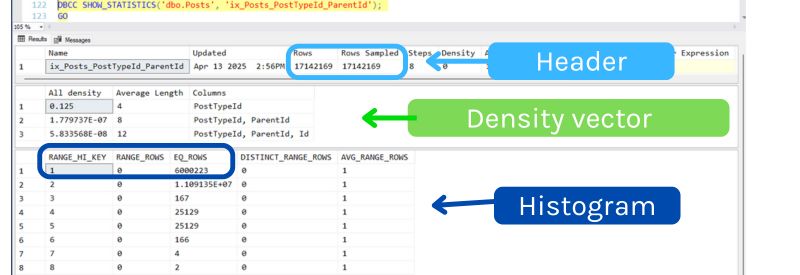
In this case, it looks like the fact that we have a multi-column statistic didn’t really give the optimizer too much new information it thought was useful.
Yes, the density vector implies that there are 3.05 rows on average for any given combination of PostTypeId and ParentId values on average, but the estimate is way higher than 3 rows. It looks like our estimate is still based on histogram values, and the estimate went up a little bit because the histogram for the new index– which is only on the leading column, PostTypeId– estimated a slightly higher number of rows for PostTypeId = 1.
Now, I could create a multi-column filtered index that is perfect for my query. But let’s say that this query doesn’t run that often, and I don’t want to create an index just for it. However, I want to see if SQL Server might be smarter if I gave it a statistic.
I create a statistic that is very targeted for my query, like this:
CREATE STATISTICS
    FilteredStats_Posts_PostTypeId_ParentId_AnswerCount
ON dbo.Posts
(
    PostTypeId,
    ParentId,
    AnswerCount
)
WHERE PostTypeId = 1
AND   ParentId = 0
AND   AnswerCount = 0;
GO
One thing I’ve noticed is that when you create a statistic like this, it won’t automatically make queries recompile. I have an OPTION (RECOMPILE) clause in my query, though, so I don’t have to worry about that.
Rerunning my query, I get the same shape plan, but the estimates are much more accurate:
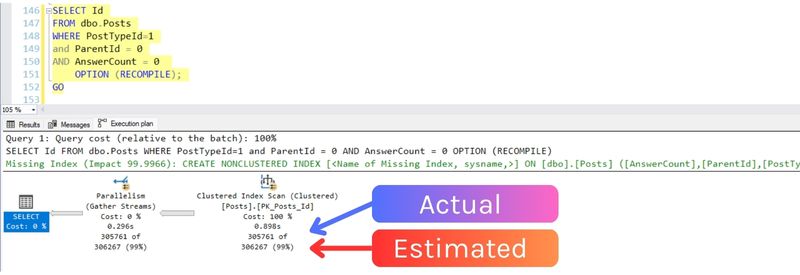
With the filtered multi-column statistic, SQL Server is estimating that 306,267 will be returned, very close to the actual rowcount of 305,761.
This doesn’t make much of a difference in this simple case, but if I was joining to this table and the data was flowing into an operator that needed to allocate memory, like a hash join or a sort, this estimate could make a difference.
Real world talk: I don’t go around creating statistics like this “just in case”, and I wouldn’t assume that this will automatically solve a problem– but sometimes this can help in a specific situation where it doesn’t make sense to create an index and poor row estimates are causing a performance problem.
SQL Server has two cardinality estimators: the “legacy” cardinality estimator, which applies to database compatibility level 110 and below (or if you have it enabled as a database scoped configuration), and the “doesn’t really have a name”/newer cardinality estimator.
The legacy cardinality estimator is more likely to assume that data distributions on different columns are independent of one another.
If I have the filtered statistic created and the two column index created, and I run my query using the legacy cardinality estimator, SQL Server decides to use the non-covering index and do a nested loop lookup to pick up the AnswerCount data (which is not in the index).
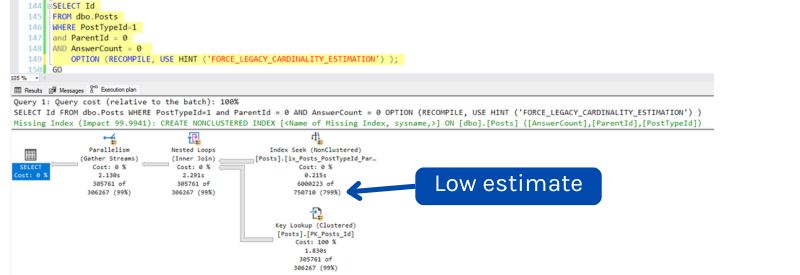
The row estimate for how much will come out of the nested loop operator is very accurate: 306,267 rows (actual is 305,761).
However, SQL Server estimates that 750,710 rows will come out of the index on PostTypeId, ParentId, whereas it actually had 6,000,223 rows returned from the operator.
Statistics help SQL Server guess row counts.
Statistics are estimates, and close-enough is usually fine. Don’t chase perfection.
Auto-created single-column stats have a histogram that describes how data is distributed in one column at a time. If your query filters on multiple columns, SQL Server has to guess how those filters work together.
Multi-column stats (created with multi-column indexes, or manually) only have a histogram for the leading column.
Filtered statistics can help with tricky queries where the estimate is way off and you don’t want (or need) a new index. If you match the filter exactly, the estimate can get much better.
Don’t assume “bad estimate” means “bad stat” or “bad plan”. Estimates can be off and still lead to a good plan. Make sure to verify if your problem has to do with “statistics were wrong” or if it’s a case of “the statistics were fine for the values the query plan was compiled with, but then the plan ran with different values for parameters” (a parameter sniffing problem).
Avoid the “just fullscan all your statistics” trap. Updating statistics with fullscan all the time burns IO and slows down over time. Becoming dependent upon this can leave you in a reactive position where you regularly have poor performance.
The version of the cardinality estimator matters. Sometimes the legacy cardinality will work better for a query. Sometimes it won’t.


Copyright (c) 2025, Catalyze SQL, LLC; all rights reserved. Opinions expressed on this site are solely those of Kendra Little of Catalyze SQL, LLC. Content policy: Short excerpts of blog posts (3 sentences) may be republished, but longer excerpts and artwork cannot be shared without explicit permission.