Adaptive Joins and Memory Grants in SQL Server
Adaptive joins let the optimizer choose between a Hash Join and a Nested Loop join at runtime, which can be fantastic for performance when row count …
Read MoreSQL Server 2016’s new Query Store feature has an option that looks for “regressed” query plans.
But does it catch “bad” parameter sniffing?

Plan choice regression is explained in Books Online this way:
During the regular query execution Query Optimizer may decide to take a different plan because important inputs became different: data cardinality has changed, indexes have been created, altered or dropped, statistics have been updated, etc. For the most part new plan it picks is better or about the same than one was used previously. However, there are cases when new plan is significantly worse - we refer to that situation as plan choice change regression.
Simply put, we’re looking for queries that have gotten slower.
Of course I started wondering exactly which scenarios might still be hard to identify with the new feature. And I wondered– does it have to be two different query execution plans? Or could it find same plan which is sometimes fast and sometimes slow? In this post I’ll show:
When you reuse parameterized code in SQL Server, the optimizer “sniffs” the parameters you compile the query with on the first run, then re-uses that plan on subsequent executions. Sometimes you get a case where that first run is fast, but later runs are slow because the execution plan really isn’t great for every set of input values.
Here’s an example of some code that’s particularly troublesome. This uses the free SQLIndexWorkbook database– later renamed to BabbyNames:
CREATE INDEX ix_FirstNameByYear_FirstNameId on
    agg.FirstNameByYear (FirstNameId);
GO

IF OBJECT_ID('NameCountByGender','P') IS  NULL
    EXEC ('CREATE PROCEDURE dbo.NameCountByGender AS RETURN 0')
GO

ALTER PROCEDURE dbo.NameCountByGender
    @gender CHAR(1),
    @firstnameid INT
AS
    SET NOCOUNT ON;

    SELECT
        Gender,
        SUM(NameCount) as SumNameCount
    FROM agg.FirstNameByYear AS fact
    WHERE
        (Gender = @gender or @gender IS NULL)
        AND
        (FirstNameId = @firstnameid or @firstnameid IS NULL)
    GROUP BY Gender;
GO
I’ve enabled QueryStore on the SQLIndexWorkbook database. I clear out any old history to make it easy to see what’s going on with my examples with this code:
ALTER DATABASE SQLIndexWorkbook SET QUERY_STORE CLEAR;
GOI first run the stored procedure 100 times for males named Sue. This gets a plan into cache that is under 100 milliseconds when run for specific names, but takes more than a second if the @firstnameid parameter is passed in as NULL.
Here’s that first run:
EXEC dbo.NameCountByGender @gender='M', @firstnameid=91864;
GO 100
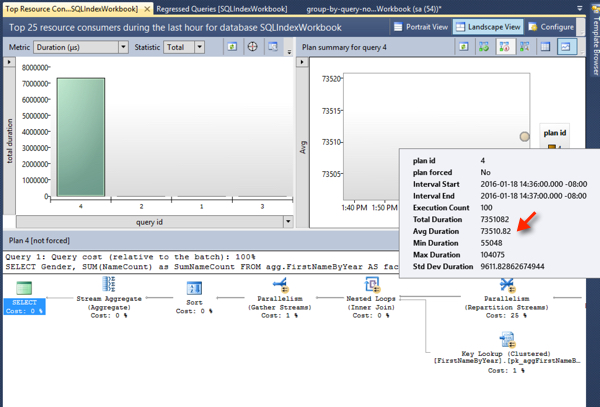
After running the “fast query” 100 times, I open QueryStore’s “Top Resource Consuming Queries” report and can see it right away. The average duration of the query was 73.5 milliseconds:
Let’s re-run the stored procedure with different values – the slow ones, that looks at the values for all men. This will reuse the exact same plan, but it will perform much more slowly. We only run it twice:
EXEC dbo.NameCountByGender @gender=M, @firstnameid=NULL;
GO 2
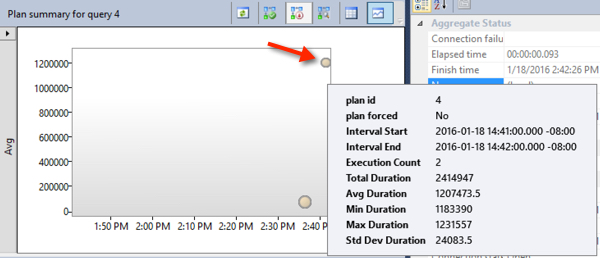
I happened to run the query in a new “interval” or time period. This means the slow plan now shows up right away in the top resource consumers to the right of the old plan. Hovering over the circle for the plan, it saw both runs and saw an average duration of 1.2 seconds.
But then, the procedure is run 100 more times for a specific first name, the fast version:
EXEC dbo.NameCountByGender @gender='M', @firstnameid=91864;
GO 100
The Query Store report is showing us the bubbles based on the average duration. This makes the bubble move downward in the graph after those executions:
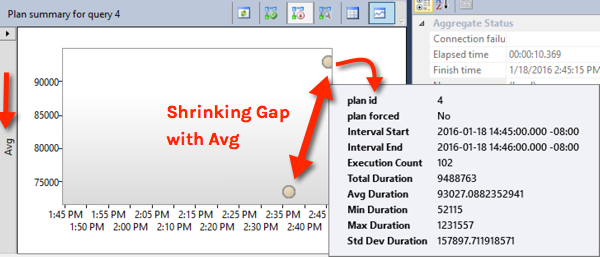
It’s possible to see that there was a slow run by changing the graph to show the “max duration”, but you have to know to do that.
Here’s what my Regressed Queries report looks like:
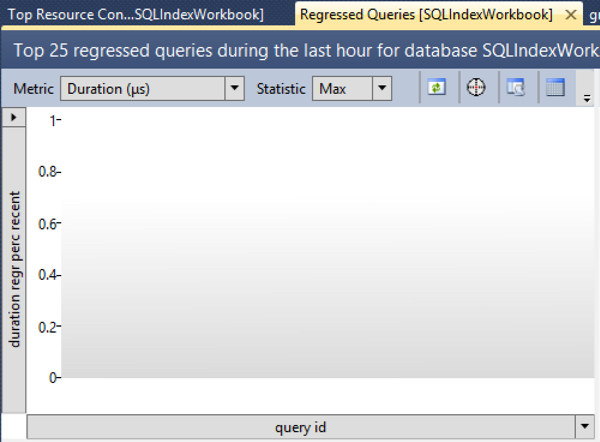
Even looking at the “Max” statistic, this query doesn’t show up.
There’s one easy way to figure this out. I opened SQL Server Profiler, selected the Tuning template, and refreshed the Regressed Query report. (I still use Profiler for stuff like this because I can do that sequence in about three seconds. Hey, I’m lazy.) Here’s the query that the Regressed Query report looks like it’s using (as of 2016 CTP 3.2 at least):
exec sp_executesql N'WITH
hist AS
(
    SELECT
        p.query_id query_id,
        CONVERT(float, MAX(rs.max_duration)) max_duration,
        SUM(rs.count_executions) count_executions,
        COUNT(distinct p.plan_id) num_plans
    FROM sys.query_store_runtime_stats rs
        JOIN sys.query_store_plan p ON p.plan_id = rs.plan_id
    WHERE NOT (rs.first_execution_time > @history_end_time OR rs.last_execution_time < @history_start_time)
    GROUP BY p.query_id
),
recent AS
(
    SELECT
        p.query_id query_id,
        CONVERT(float, MAX(rs.max_duration)) max_duration,
        SUM(rs.count_executions) count_executions,
        COUNT(distinct p.plan_id) num_plans
    FROM sys.query_store_runtime_stats rs
        JOIN sys.query_store_plan p ON p.plan_id = rs.plan_id
    WHERE NOT (rs.first_execution_time > @recent_end_time OR rs.last_execution_time < @recent_start_time)
    GROUP BY p.query_id
)
SELECT TOP (@results_row_count)
    results.query_id query_id,
    results.query_text query_text,
    results.duration_regr_perc_recent duration_regr_perc_recent,
    results.max_duration_recent max_duration_recent,
    results.max_duration_hist max_duration_hist,
    ISNULL(results.count_executions_recent, 0) count_executions_recent,
    ISNULL(results.count_executions_hist, 0) count_executions_hist,
    queries.num_plans num_plans
FROM
(
    SELECT
        hist.query_id query_id,
        qt.query_sql_text query_text,
        ROUND(CONVERT(float, recent.max_duration-hist.max_duration)/NULLIF(hist.max_duration,0)*100.0, 2) duration_regr_perc_recent,
        ROUND(recent.max_duration, 2) max_duration_recent,
        ROUND(hist.max_duration, 2) max_duration_hist,
        recent.count_executions count_executions_recent,
        hist.count_executions count_executions_hist
    FROM hist
        JOIN recent ON hist.query_id = recent.query_id
        JOIN sys.query_store_query q ON q.query_id = hist.query_id
        JOIN sys.query_store_query_text qt ON q.query_text_id = qt.query_text_id
    WHERE
        recent.count_executions >= @min_exec_count
) AS results
JOIN
(
    SELECT
        p.query_id query_id,
        COUNT(distinct p.plan_id) num_plans
    FROM sys.query_store_plan p
    GROUP BY p.query_id
) AS queries ON queries.query_id = results.query_id
WHERE duration_regr_perc_recent > 0
ORDER BY duration_regr_perc_recent DESC
OPTION (MERGE JOIN)',N'@results_row_count int,@recent_start_time datetimeoffset(7),@recent_end_time datetimeoffset(7),@history_start_time datetimeoffset(7),@history_end_time datetimeoffset(7),@min_exec_count bigint',@results_row_count=25,@recent_start_time='2016-01-18 14:00:42.7253669 -08:00',@recent_end_time='2016-01-18 15:00:42.7253669 -08:00',@history_start_time='2016-01-11 15:00:42.7253669 -08:00',@history_end_time='2016-01-18 15:00:42.7253669 -08:00',@min_exec_count=1;
GO
First up, I don’t see anything in that TSQL that insists that a “regressed” query must have different execution plans at different sample times. That’s good! (The Books Online text raised this as a question for me.)
Our query isn’t showing up in the results because of the “WHERE duration_regr_perc_recent > 0” predicate. I dug into the data, and our query (query_id=4), has max_duration_recent = 1231557 and max_duration_hist = 1231557. My ‘recent’ period was defined as the latest hour. Based on the pattern sampled, it sees the regression as zero.
In other words, our query was sometimes fast and sometimes slow in the last hour. It hadn’t run before that, so it wasn’t slower than it had been historically.
If a frequently executed query is usually fast but occasionally slow, and that pattern happens frequently across sample times, that query may not always show up in the regressed queries pane.
But if it’s one of the most frequent queries on your system, it will still show up in Query Store’s “Top Resource Consumers” report, regardless. We had no problem at all seeing it there.
The Query Store reports have lots of great options. Averages are interesting, but switching to view the max can help identify when you’ve got something causing a high skew in query execution time. I also prefer looking at CPU time (how much time did you spend working) rather than duration, because duration can be extended by things like blocking.
Here’s what the chart in the “Top 25 Resource Consumers” report looks like for Max CPU time for our query for that time period:
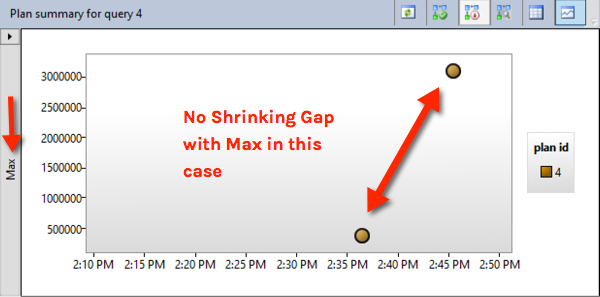
That jumps out a little more as having an anomalous long run!
Copyright (c) 2025, Catalyze SQL, LLC; all rights reserved. Opinions expressed on this site are solely those of Kendra Little of Catalyze SQL, LLC. Content policy: Short excerpts of blog posts (3 sentences) may be republished, but longer excerpts and artwork cannot be shared without explicit permission.